
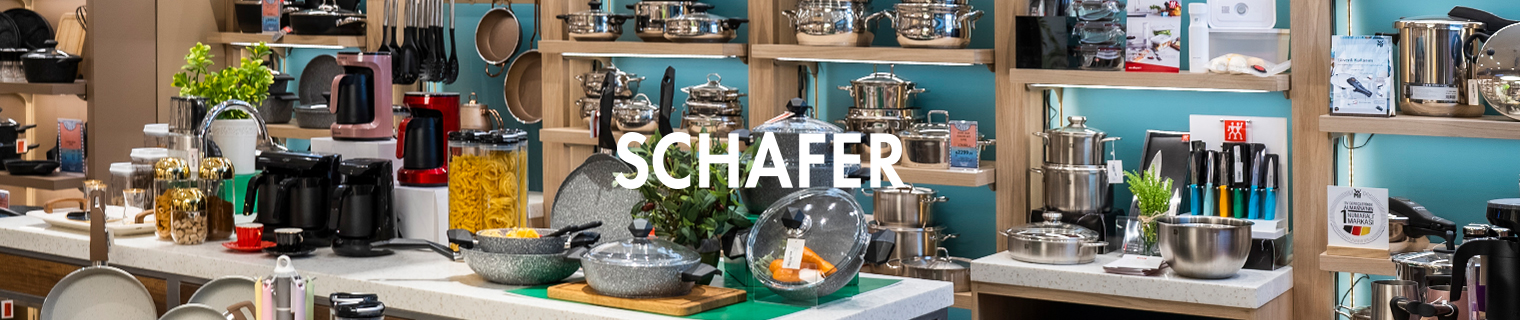
Schafer: Up to 76% Growth in Store Traffic
We drove up to 76% more store traffic for Schafer
This one did not end on the website. We measured a local search campaign in actual footfall.
THE BRAND
About Schafer
Schafer is a home and kitchen brand of German origin. All brand rights have been held by Türkiye based Aslan Ticaret since 2009.
The range runs to nearly two thousand eight hundred products, from tableware and cookware to small appliances and home textiles, produced through a supplier network rather than an owned factory.
The channel mix is wide: own stores, franchise, wholesale, own e-commerce, marketplaces and export, all running at the same time.
In a setup like that, digital has to prove itself in store visits, not just in sessions. We built the campaign and the measurement around that from the start.
WHERE WE STARTED
What we were up against
What stood in the way when we started. The order is not random, we went after the highest impact first.
No way to tie digital work to store visits
Store information missing or wrong in local results
No way to target at the store level
Mall and high street locations behaving nothing alike
Campaign results collapsed into one aggregate number
Seasonal demand swinging differently store by store
THE PLAN
What we did
1
We built it store by store
Instead of one brand campaign, we built a structure targeted separately for each of fifty-five stores.
2
We fixed the local search layer
Store information, category signals and local visibility, cleaned up one location at a time.
3
We measured it the same way
We read results per store rather than in aggregate, which made it obvious which locations were working and why.
RESULTS
What actually moved
| Metric | Change | Comparison |
|---|---|---|
| Sivas Prime Hall | +76.59% | Campaign period |
| Forum Çamlık | +51.73% | Campaign period |
| Optimum İzmir | +38.56% | Campaign period |
| Hilltown AVM | +34.61% | Campaign period |
| Kayseri Forum | +27.21% | Campaign period |
| Average across 55 stores | +11% | Campaign period |
Numbers come from the brand's own Search Console and analytics. The comparison window is stated on every row.
THE TAKEAWAY
Digital work can be measured in footfall too
The overall average is 11%. Store by store the picture looks completely different. An average is where the useful information goes to die.
Store level viewEvery store read on its own, instead of fifty-five of them hidden inside one number.
A base that lastsWhat is left is an organic base that compounds instead of resetting the day the work stops.
One viewSearch visibility, store visits and revenue read off one screen instead of three separate reports.
Let the next one be yours
We will review where your visibility stands and talk through how far it can go.